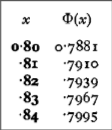
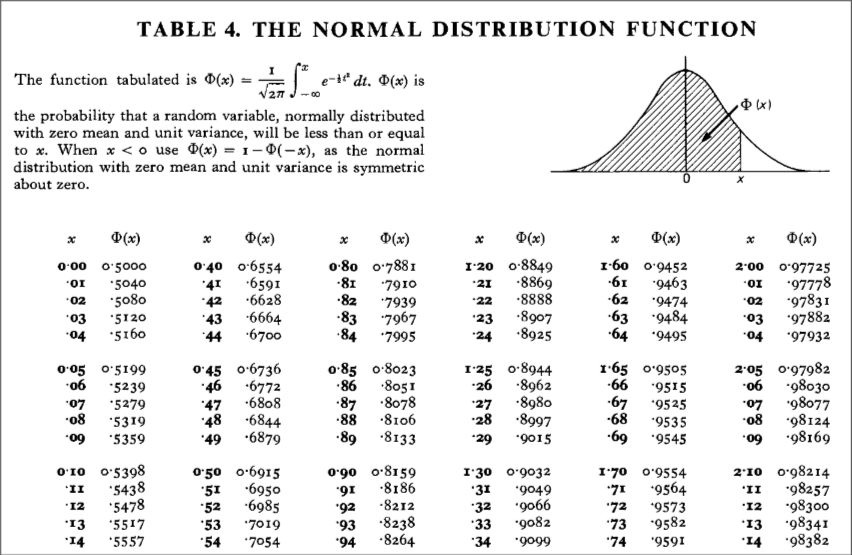
A Normal Distribution table is a collection of values which allow us to figure out the percentage of values below a given Z-Score.
Example:
To read :
- Verify the direction of the table (usually less than), if it is different you must convert your Z-Score Probability to match:
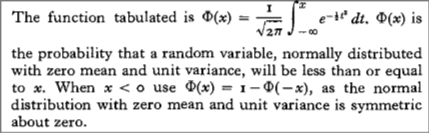
- Read along the column until you see the matching value, e.g
- Read the output column